PJ01 - Weather Stats
“I want to go to there!” -Liz Lemon
Overview
Come May of 2021 we’ll all deserve a vacation to somewhere with great weather. In this project, you will write a program to analyze publicly available weather data sourced from the National Oceanic and Atmospheric Administration (NOAA). Your program will read in data collected at an airport station over a period of time to produce statistics like average temperature, maximum wind, a listing of readings, and so on. You can use this tool to begin planning your summer escape!
Learning Objectives
- Practice processing a real-world dataset stored in a CSV format with
csv.DictReader- Datatype conversions
- Data filtering
- Experience writing a command-line interface program with arguments using
sys.argv - Confront a program with opportunities to structure it in ways to minimize redundancy
- Learn how to navigate a public repository to acquire a data set (NOAA)
Getting Started
To begin, create a new directory (“Folder”) in your Workspace’s projects directory named pj01. Inside the projects/pj01 directory, create a new Python module named weather.py.
Go ahead an add a descriptive docstring to the top of the file and an __author__ field with your PID.
Getting a Data Set in CSV Format
The initial challenge of this project is aquiring a source data CSV and making sense of it. NOAA offers many different data sets of different scales and specificities. For this project’s purposes, we will narrow down the focus to a specific dataset: readings from land-based stations such as airports.
- Browse to NOAA’s Center for Environmental Information: https://www.ncdc.noaa.gov/
- Navigate to Data Access
- Find the link to Land-based Station data
- Select Datasets and Products
- Select Local Climatological Data
Next you will be presented with a tool for selecting a station. Larger weather stations found at international airports tend to have the most complete and reliable readings and recordings. You are encouraged to select a station at a large airport (e.g. Raleigh-Durham sized or greater) near a city you would want to fly into or out of! (Notice how far back the historical records you have access date to!)
Once you’ve found your station, click “Add to Cart”. Don’t worry, this is all free, publicly accessible data made possible through tax-payer funded science and engineering.
Navigate to your cart either by clicking on the orange bar at the bottom of your screen or by scrolling up to the top-right orange Cart link.
Select an output format of LCD CSV.
Important: select a date range of May 10th, 2020 to May 16th, 2020. Be sure to cick apply after selecting your start and end date. Check to be sure the date range is correct. After you complete the core requirements of this project, you are encouraged to explore other date ranges and larger data sets.
Enter your email address (don’t worry, this isn’t a company so you won’t get added to a spam list). Click Submit Order. You will see a screen that tells you the order was submitted and that you’ll receive an e-mail once your requested data set is available for download. You can click “Check order status” and give it a minute before refreshing. For such a small data pull this typically gets processed quickly. Otherwise, if you want to you can wait for the email to come in and follow the email link.
Once your data set is available for download follow the link and your CSV file will go to your downloads folder or desktop. Its name will be your order number followed by “.csv” which isn’t too convenient. Go ahead and rename it to 2020-05-10-to-16.csv.
Pro-tip: when naming files that involve specific date ranges, use a format as demonstrated in this file name. Why? Arranging the year first, followed by the month with
0padding, followed by a date makes it such that your files will be in chronological order when you sort a directory of files.
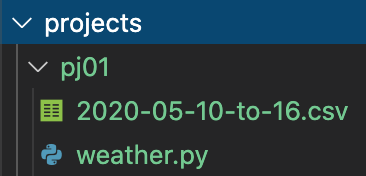
Copy or drag your file 2020-05-10-to-16.csv file into your pj01 directory in VSCode. It should look as follows:
NOAA Down? Sample Data File
NOAA currently down or erroring out? You can use this CSV file in the mean time. You’ll want to find a warmer data set in your project submission fr, so come back to NOAA and try again soon!
Viewing CSV Data
Before attempting to write a program to operate on a data source you should understand its contents.
If you open the CSV file in code, you’ll see it in the plaintext format that your program will read and analyze. Notice how difficult it is to browse!
There’s a wonderful, free Extension for viewing CSV files in VSCode. In VSCode, navigate to View > Extensions. Search for Edit csv and the top result “extension to edit csv files” by “janisdd” is the one to install. Go ahead and install it.
Then, open your CSV file in VSCode again, and you should see the following button appear:
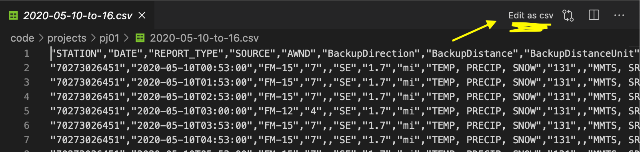
Click it! This will open up the Edit CSV Extension’s view of your data in tabular format.
Pro-tip: Do not make any edits to your CSV files while working on data-driven projects! Ensuring that your program works by reading data produced directly from the sources will make it possible for your program to process any other data file from the same source without any manual intervention needed. Our automatic tests will use an alternate data source directly from NOAA.
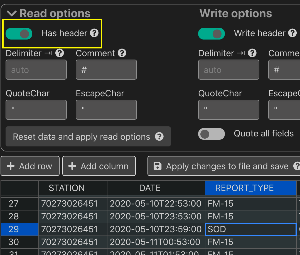
Since our data file has a first row which contains column names, the extension has an option to “Freeze” the column headers with the first row’s values. Enable the _Has Header" Read Option as shown:
CSV Observations
Spending five minutes scanning through the source data is time well spent. For the purposes of this project there are a few things to emphasize:
Each row is either an hourly reading or daily summary. In this project the focus will be on the daily summaries exclusively, not on the hourly readings. The
REPORT_TYPEcolumn tells you whether it’s an hourly or summary of day:SOD. Since you downloaded a week’s worth of data, you should be able to find 7 rows with a value ofSODin theREPORT_TYPEcolumn.- There are many columns! Those prefixed with
Dailyare for the summary of day readings. In this project there are two daily columns our examples will highlight:DailyAverageDryBulbTemperatureDailyAverageWindSpeedDailyPrecipitation
Guidelines
The following requirements will drive the learning experience of this project.
Driven by command-line arguments
Your program should run as a Python module from the command-line with three required arguments:
- The path to the CSV
FILEto process - The
COLUMNof focus - The
OPERATIONto perform (any oflist,min,avg,max)
When your program is run without the required options, you should print a usage line. For example:
$ python -m projects.pj01.weather
                Usage: python -m projects.pj01.weather [FILE] [COLUMN] [OPERATION]
The list Operation
This is the first operation you should implement as it should help simplify your implementations of the other operations!
The list operation should produce and print a List[float] for each of the COLUMN argument’s values in a row whose REPORT_TYPE contains the string SOD.
Example usage (your data will likely be different - scroll right to see complete lines):
$ python -m projects.pj01.weather projects/pj01/2020-05-10-to-16.csv DailyAverageWindSpeed list
                [5.1, 7.1, 6.8, 6.1, 6.9, 6.5, 5.9]
                $ python -m projects.pj01.weather projects/pj01/2020-05-10-to-16.csv DailyAverageDryBulbTemperature list
                [53.0, 49.0, 50.0, 49.0, 48.0, 54.0, 50.0]
                $ python -m projects.pj01.weather projects/pj01/2020-05-10-to-16.csv DailyPrecipitation list
                [0.0, 0.0, 0.0, 0.0, 0.0, 0.0]
A few notes to be careful of:
The
REPORT_TYPEfield’sSODvalue is actually a string with two trailing spaces of padding:"SOD "Some
SODdata points may be missing for a given column or may use special codes beyond our scope likeT. If you attempt to convert an empty string or"T"to afloat, aValueErrorwill be encountered. Our solution will be to ignore these kinds of errors with the following constructtry/exceptconstruct that avoids crashing our program:
A brief note on try/except blocks: try/except blocks can be used to prevent programs from crashing when an error is encountered. If you expect certain lines of code to potentially raise an error (a ValueError in our case), put them in a try block. If the error does actually end up occurring, then instead of crashing the program, the code in the except block will run. Since our solution is to simply ignore the error, the ellipsis are sufficient for the except block. If no error is raised when the try block runs, then the except block will be skipped over.
Note the results_list variable will be the variable name of whatever list you’re trying to append your values to. The empty string literal shown above should be replaced with whatever str expression you’re attempting to convert to a float value.
The min, max, and avg Operations
After completing list, add the following operations to your program:
min - The lowest value for the given column. Examples using the lists of data shown above (your results will vary based on your data set):
$ python -m projects.pj01.weather projects/pj01/2020-05-10-to-16.csv DailyAverageDryBulbTemperature min
                48.0
                $ python -m projects.pj01.weather projects/pj01/2020-05-10-to-16.csv DailyAverageWindSpeed min
                5.1
                $ python -m projects.pj01.weather projects/pj01/2020-05-10-to-16.csv DailyPrecipitation min
                0.0
max - The largest value for the given column.
$ python -m projects.pj01.weather projects/pj01/2020-05-10-to-16.csv DailyAverageDryBulbTemperature max
                54.0
                $ python -m projects.pj01.weather projects/pj01/2020-05-10-to-16.csv DailyAverageWindSpeed max
                7.1
                $ python -m projects.pj01.weather projects/pj01/2020-05-10-to-16.csv DailyPrecipitation max
                0.0
avg - The mean of all values for the given column.
$ python -m projects.pj01.weather projects/pj01/2020-05-10-to-16.csv DailyAverageDryBulbTemperature avg
                50.42857142857143
                $ python -m projects.pj01.weather projects/pj01/2020-05-10-to-16.csv DailyAverageWindSpeed avg
                6.3428571428571425
                $ python -m projects.pj01.weather projects/pj01/2020-05-10-to-16.csv DailyPrecipitation avg
                0.0
A few notes to consider:
- You are allowed to use Python’s built-in
min,max, andsumfunctions in the implementation of this requirement. See the official Python documentation for how to use each.
User-Experience Diagnostics
If the user attempts to use any column that does not exist in the CSV, respond with the following error and exit() the process:
$ python -m projects.pj01.weather projects/pj01/2020-05-10-to-16.csv DailyAverageTemperature avg
                Invalid column: DailyAverageTemperature
                $ python -m projects.pj01.weather projects/pj01/2020-05-10-to-16.csv DailyRain avg
                Invalid column: DailyRain
If the user attempts to use any operation beyond those above, or those which you add as an extension, respond with the following error and exit() the process:
$ python -m projects.pj01.weather projects/pj01/2020-05-10-to-16.csv DailyAverageWindSpeed average
                Invalid operation: average
                $ python -m projects.pj01.weather projects/pj01/2020-05-10-to-16.csv DailyAverageWindSpeed total
                Invalid operation: total
Linting and Types
Your program should not have any stylistic errors picked up during linting or type checking errors during static type analysis (with the possible exception of pyplot issues if you choose to extend the project with PyPlot).
Program Design
Your program’s code should minimize redundancy. You should not have lots of functions, or blocks of code, which are exactly the same as others like it with a subtle data / literal changed (for example there should not be column-specific functions). The function(s) / solution you write for the
listoperation should be designed such that the other operations can make use of it without having to re-implement the process of looping through your table’s data.Use meaningful variable and function names.
Write descriptive docstrings. In your file’s top-level docstring, include the city/station your data set is sourced from.
Use named constants rather than magic numbers and strings.
Charting Above and Beyond
Add an additional chart operation to produce a pyplot chart of your data.
Produce a visualization other than a bar chart (see examples in this tutorial). Try either a line or scatter plot.
Label the x-axis with the DATE column’s values from your dataset.
Label the y-axis with the column being charted.
To complete this you should write a separate helper function for generating the chart and import pyplot within this function. For example, we could write something like this:
def chart_data(data: List[float], column: str, dates: List[str]) -> None
                    import matplotlib.pyplot as plt
                    # plot the values of our data over time
                    plt.plot(dates, data)
                    # label the x-axis Date
                    plt.xlabel("Date")
                    # label the y-axis whatever column we are analyzing
                    plt.ylabel(column)
                    # plot!
                    plt.show()
This chart_data function would only be called if the chart operation is typed at the command line. If we were to make a plot of DailyAverageWindSpeed, this command would produce the corresponding chart:
$ python -m projects.pj01.weather projects/pj01/2020-05-10-to-16.csv DailyAverageWindSpeed chart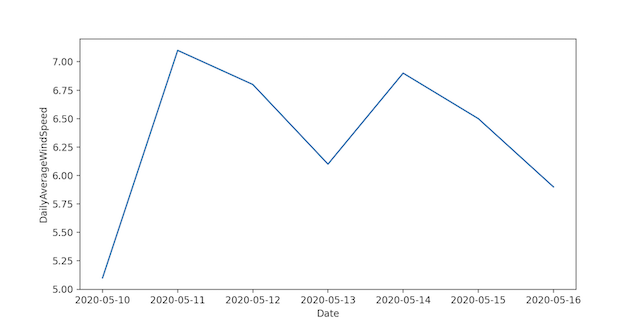
To make the chart more readable, it may be helpful to reformat the dates provided by the DATE column of your CSV. In our case, we just ignored the timestamps (all characters following the "T")
For further exploration try downloading a second dataset that is at least a month in size and generate a chart for a column you find interesting.